

Turn your ownership data into a genuine IR Strategy
- A full view of your institutional ownership, refreshed weekly from FactSet
- Identify your top buyers and sellers, and under and over-weighted fund
- Map your shareholder base by geography and investment style
The dashboard that makes your shareholder base a starting point, not a yearly audit
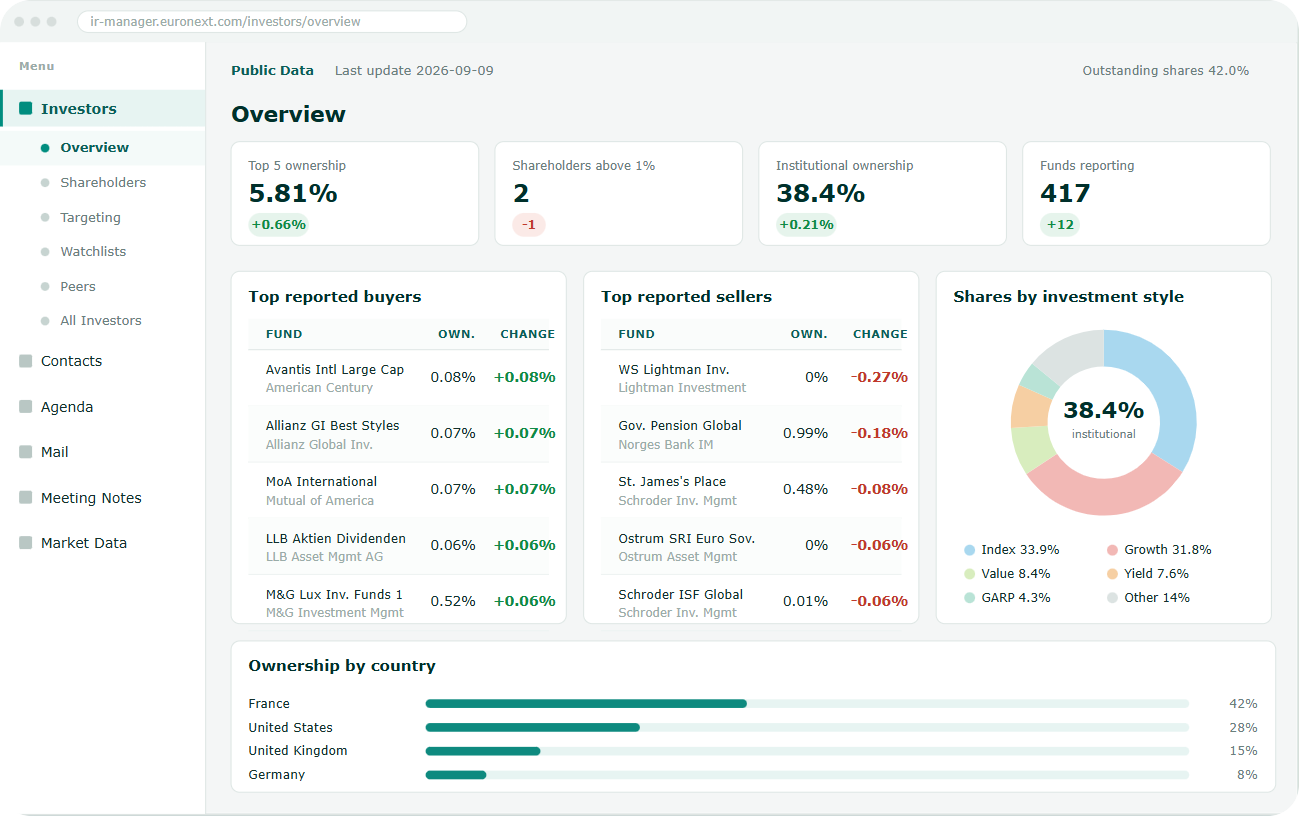
Understanding who holds your shares, who's buying, who's selling, and where the targeting opportunities lie used to mean cross-referencing several exports. My Shareholders Analytics brings this data together on a single dashboard, refreshed weekly through an automated FactSet pipeline, and designed as the new home page for your IR activity.
Understand your structure at a glance
A dynamic overview of top ownership and key shareholder thresholds.
Analyse investor behaviour
Track top reported buyers and sellers, and monitor position changes.
Target more intelligently
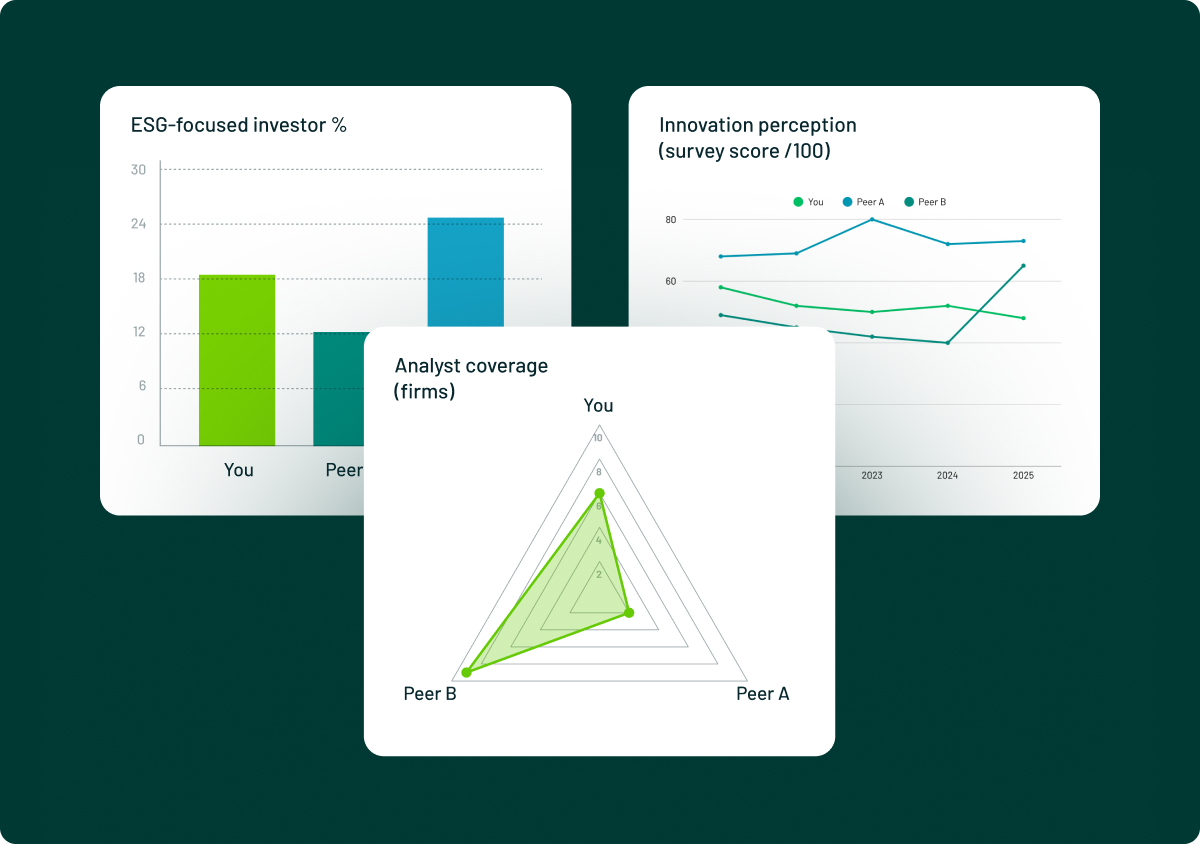
Easily identify underweighted and overweighted funds versus your peers.
Visualise your shareholder base
Interactive geographic distribution and a breakdown by investment style.
MY SHAREHOLDERS ANALYTICS
From raw data to IR decision
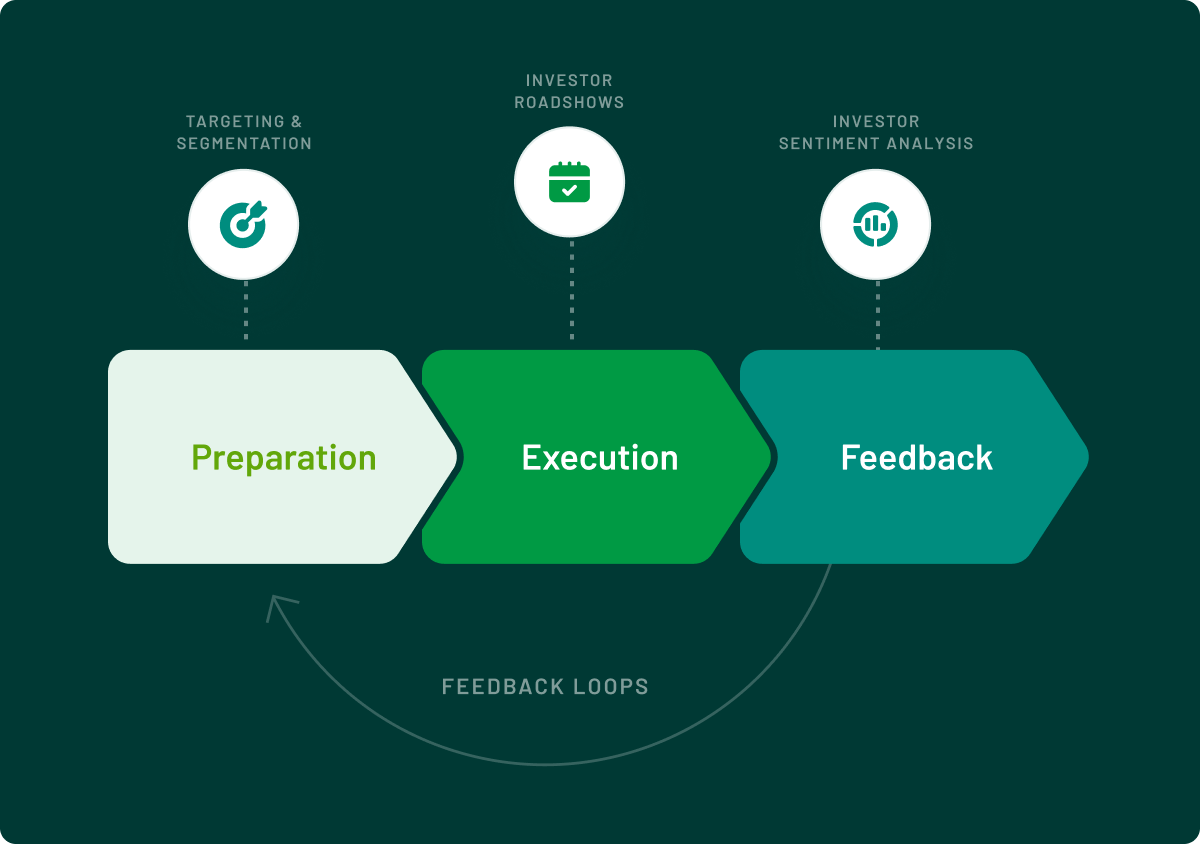
Ingest
FactSet data is ingested automatically every week.
Explore
Browse the dashboard: top holders, thresholds, changes over time.
Compare
Identify under- and overweighted funds versus peers.
Act
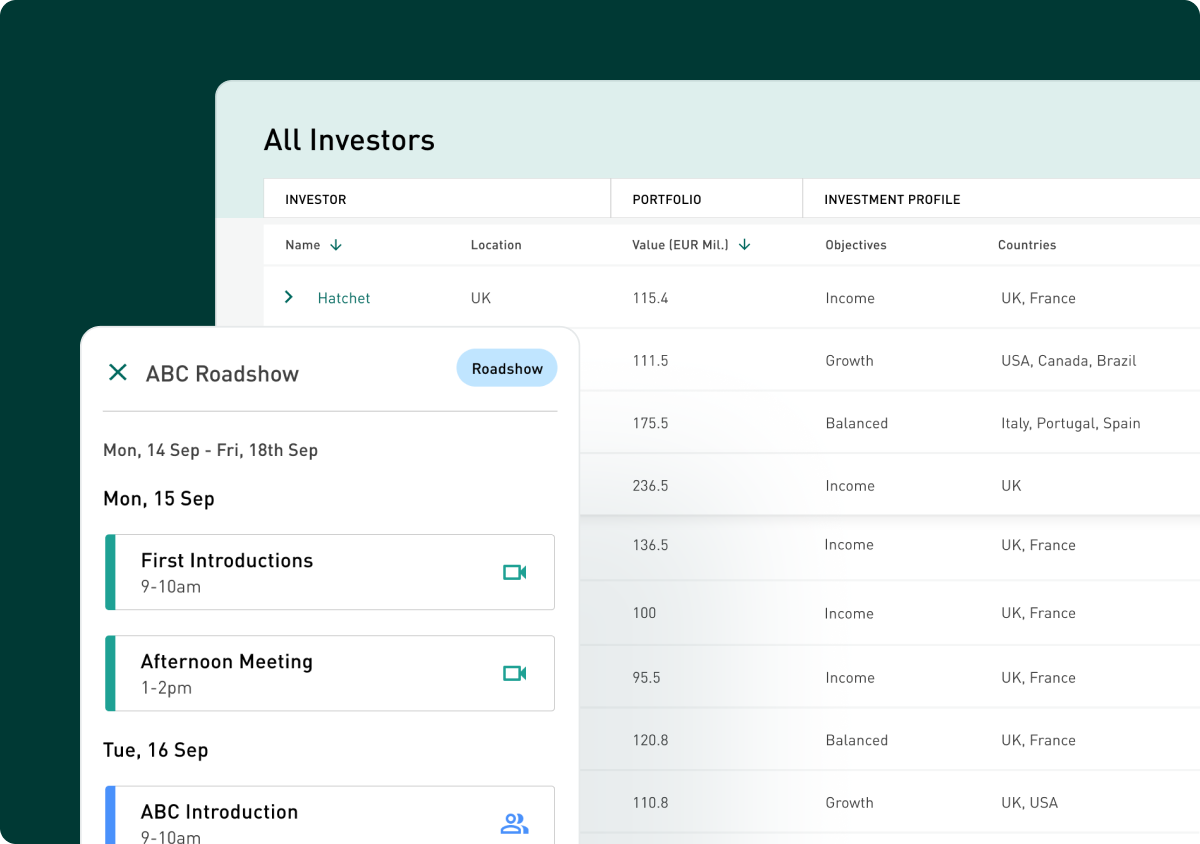
Align roadshows and targeting with the movements observed.
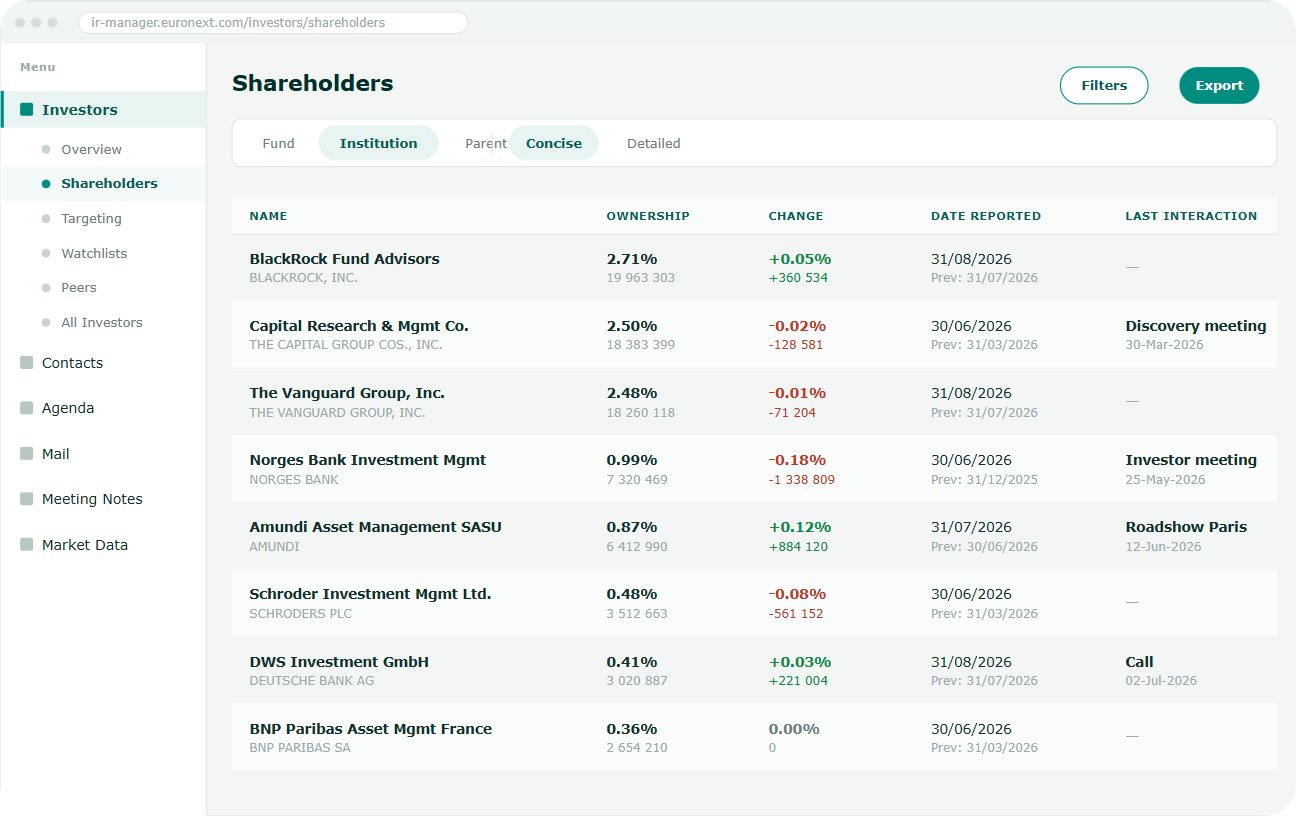
SHAREHOLDERS OVERVIEW
Your ownership structure, refreshed weekly with no manual work
A fully automated FactSet ingestion pipeline feeds the dashboard every week — no need to wait for a quarterly report to know where your shareholder base stands.
- Dynamic overview of top ownership and key shareholder thresholds
- Identification of the major contributors to ownership changes
- Data refreshed automatically every week from FactSet
INVESTOR BEHAVIOUR & TARGETING
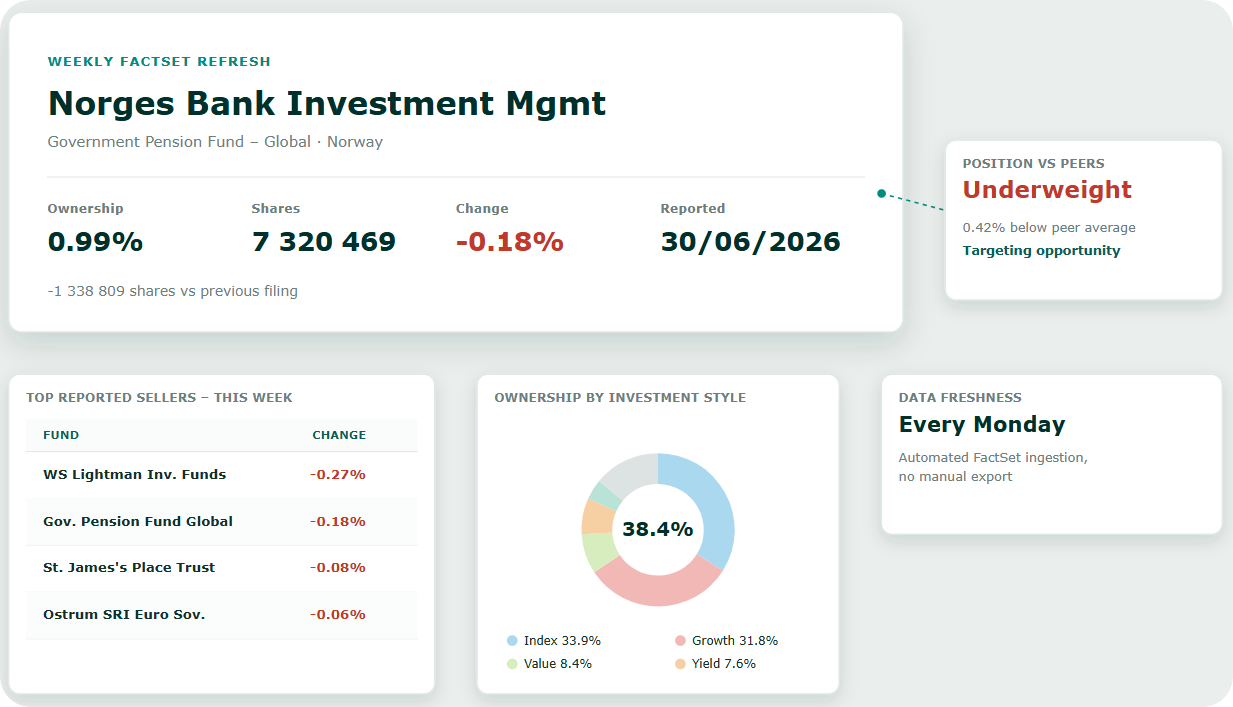
Spot underweighted funds before your competitors do
Tracking flows, position changes and each fund's positioning against your peers turns an observation into a concrete targeting action.
- Tracking of top reported buyers and sellers
- Identification of under-weighted and over-weighted funds vs peers
- Geographic and investment-style breakdown in one click
DATA QUALITY & FRESHNESS
Reliable shareholder intelligence, continuously refreshed
The dashboard runs on an automated FactSet data pipeline, with the option to go further through Euronext's shareholder identification.
Automated FactSet pipeline
Weekly ingestion of ownership data, with no manual work required.
Advanced filtering & export
Filter by fund, threshold or style, and export the views that matter.
EU hosting
Ownership data hosted and processed within the European Union.
Euronext shareholder identification
Can be combined with Euronext's Shareholder Analysis service for SRD2-compliant identification.
Go further with Shareholder Analysis
My Shareholders Analytics runs on the disclosed ownership data available through FactSet. For more precise shareholder identification, including undisclosed holders, IR.Manager can be combined with Shareholder Analysis, Euronext's dedicated shareholder identification service, integrated into IR.Manager under the name Shareholder Inside, which enriches your records with SRD2-compliant proprietary data.
FAQ
No. My Shareholders Analytics runs on the disclosed ownership data available through FactSet. For more precise, SRD2-compliant shareholder identification, IR.Manager can be combined with Euronext's Shareholder Analysis service (integrated under the name Shareholder Inside), which enriches your records with proprietary data.
The FactSet ingestion pipeline is fully automated and refreshes the data every week.
Yes, the tables and charts can be filtered by fund, threshold or investment style, and exported.
Yes, the Shareholders Analytics Overview becomes the new home page, giving an immediate view of your shareholder base as soon as you log in.