









.png)




.svg)
.svg)
.svg)







.png)
.png)






.jpg)

%20F%20(1).jpeg)







.webp)






 Login
Login


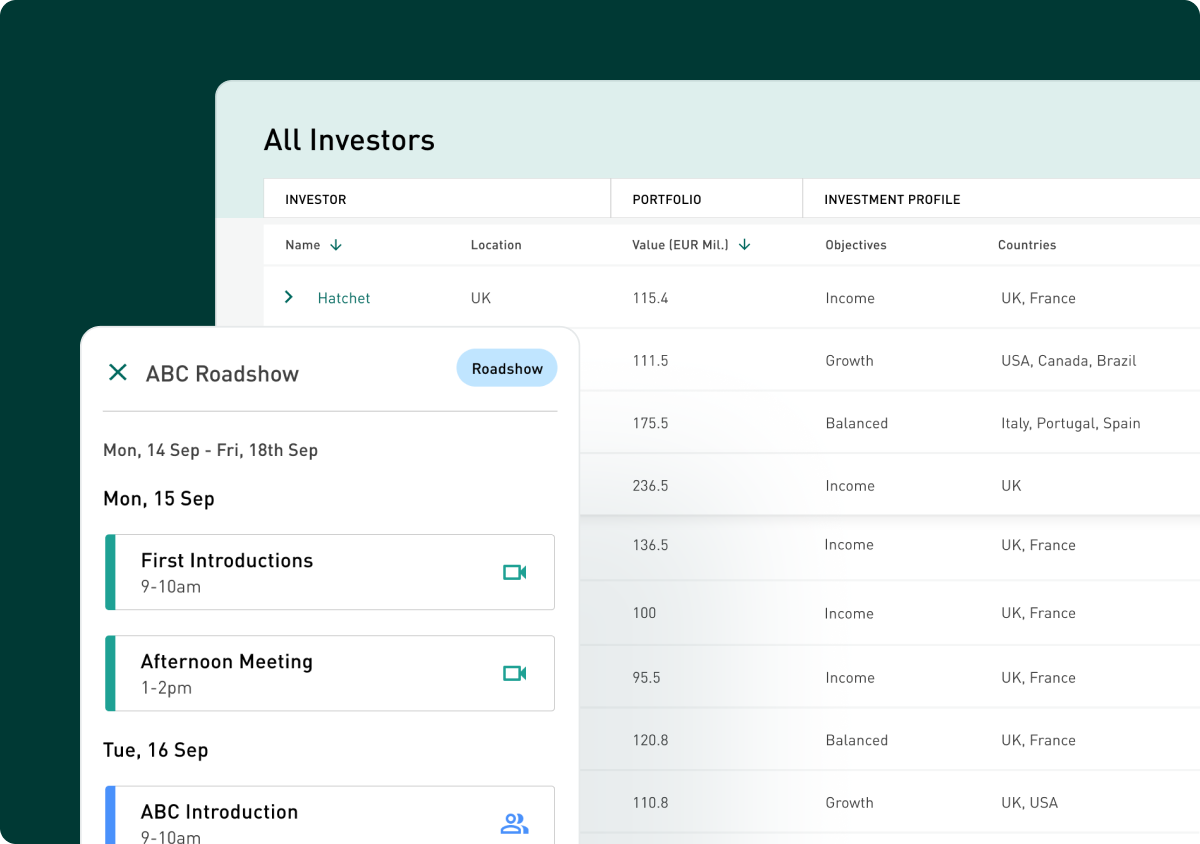
Registration & Attendance
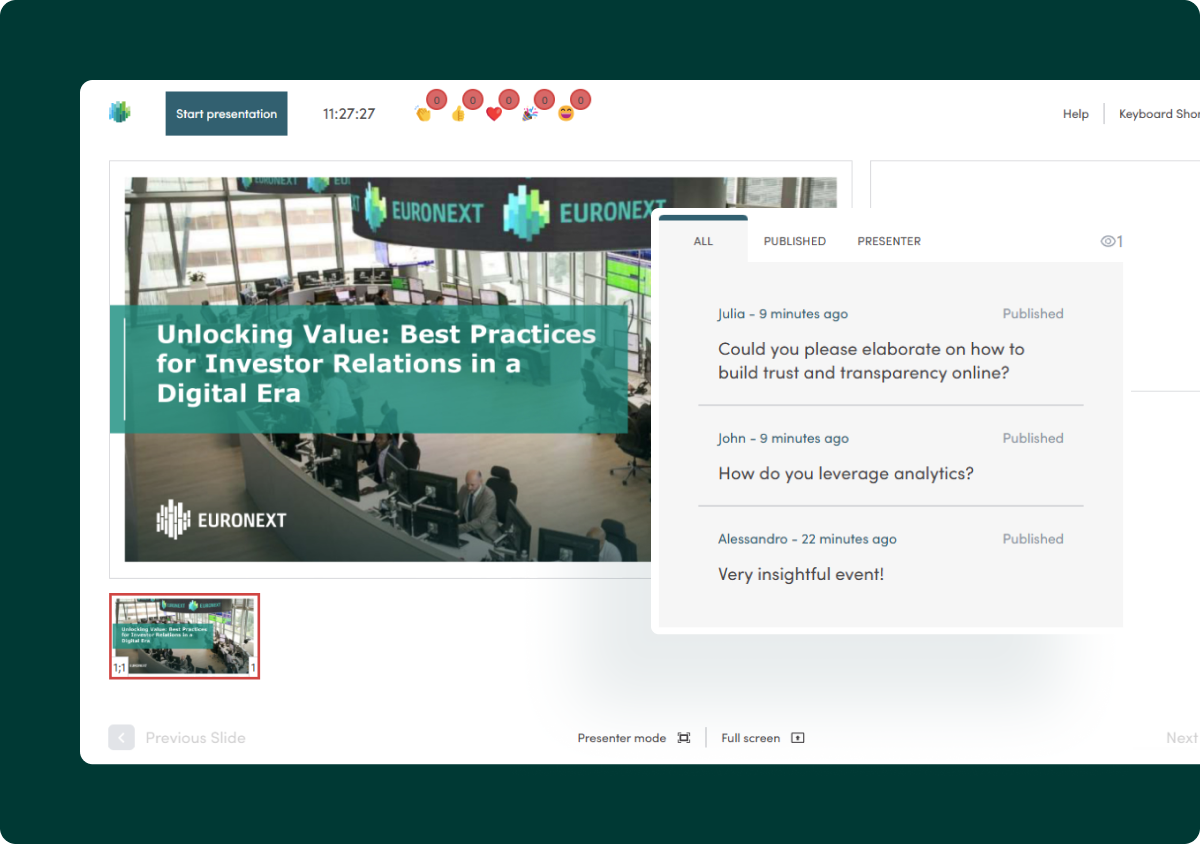
Enable attendees to submit written questions throughout the event. Questions can be moderated before being shared with speakers, helping presenters manage discussions efficiently while maintaining control of the session.

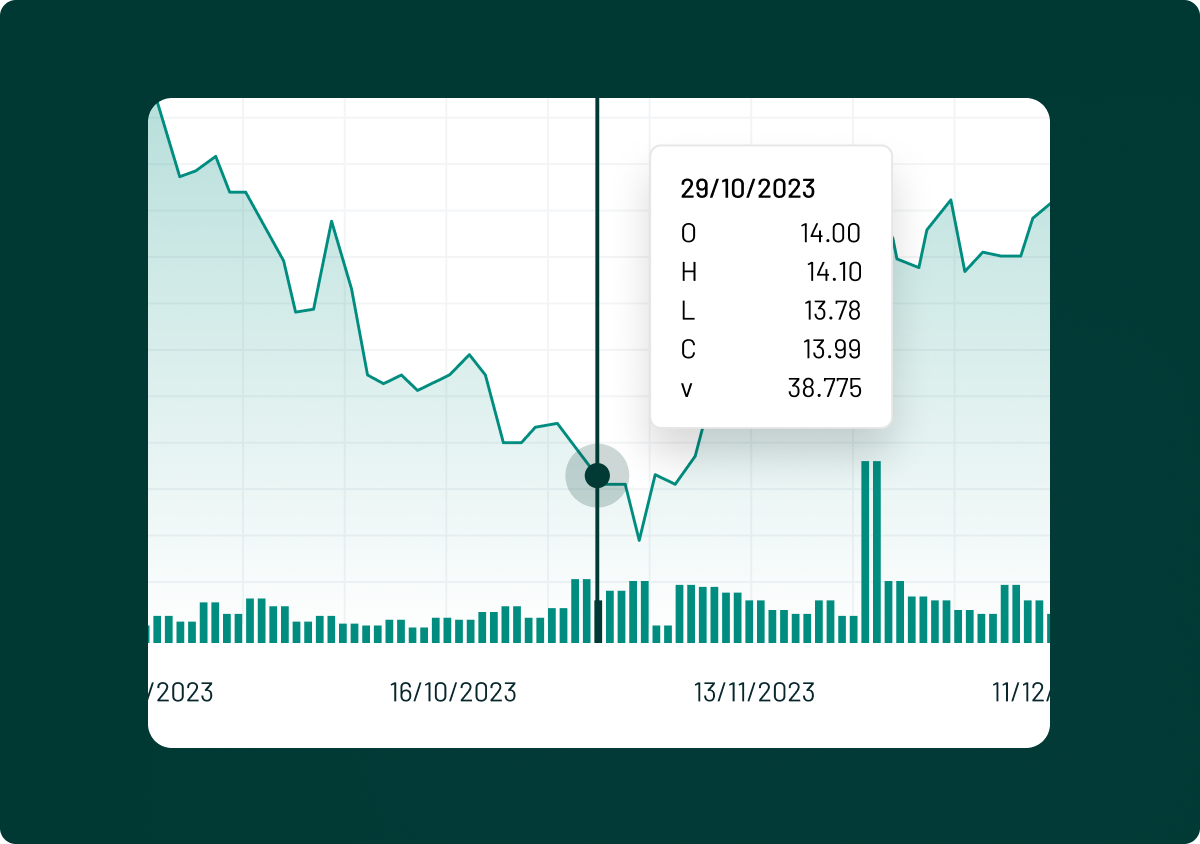
Viewing Statistics
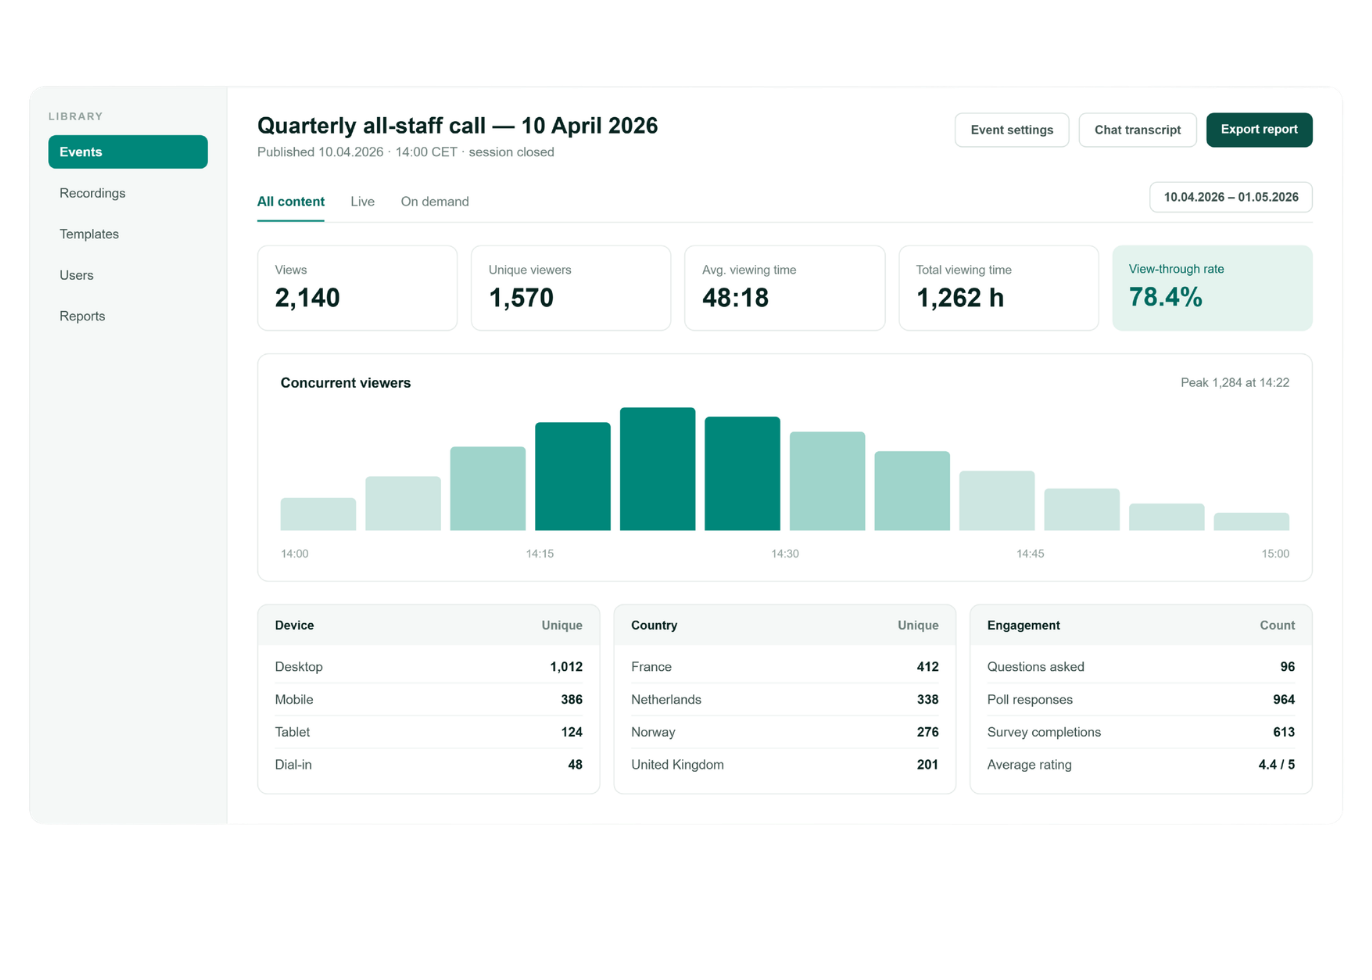
Track viewing activity to measure how audiences engaged with your event and analyse overall event performance.

Audience Engagement
Understand how attendees interacted throughout the webcast by analysing participation across questions, hand raises and poll responses.

Geographic Insights
View where your audience joined from to better understand the reach of your communications.
Dashboard Access
Access your event dashboard at any time during the hosting period to review performance data without waiting for manual reports.
Export Your Data
Generate customisable Excel reports containing data from pre-production, live and post-event activity for further analysis or internal reporting.
EVENT ANALYTICS
Turn event data into meaningful insights
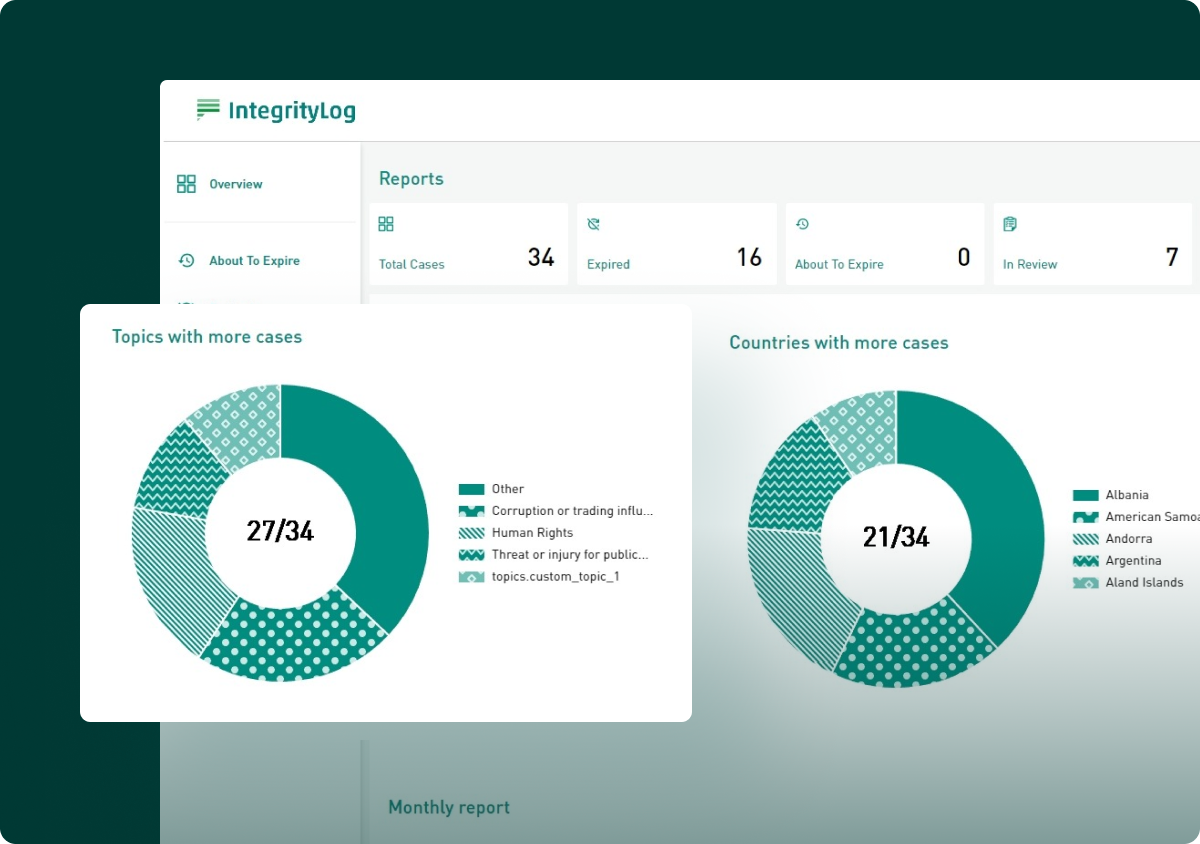
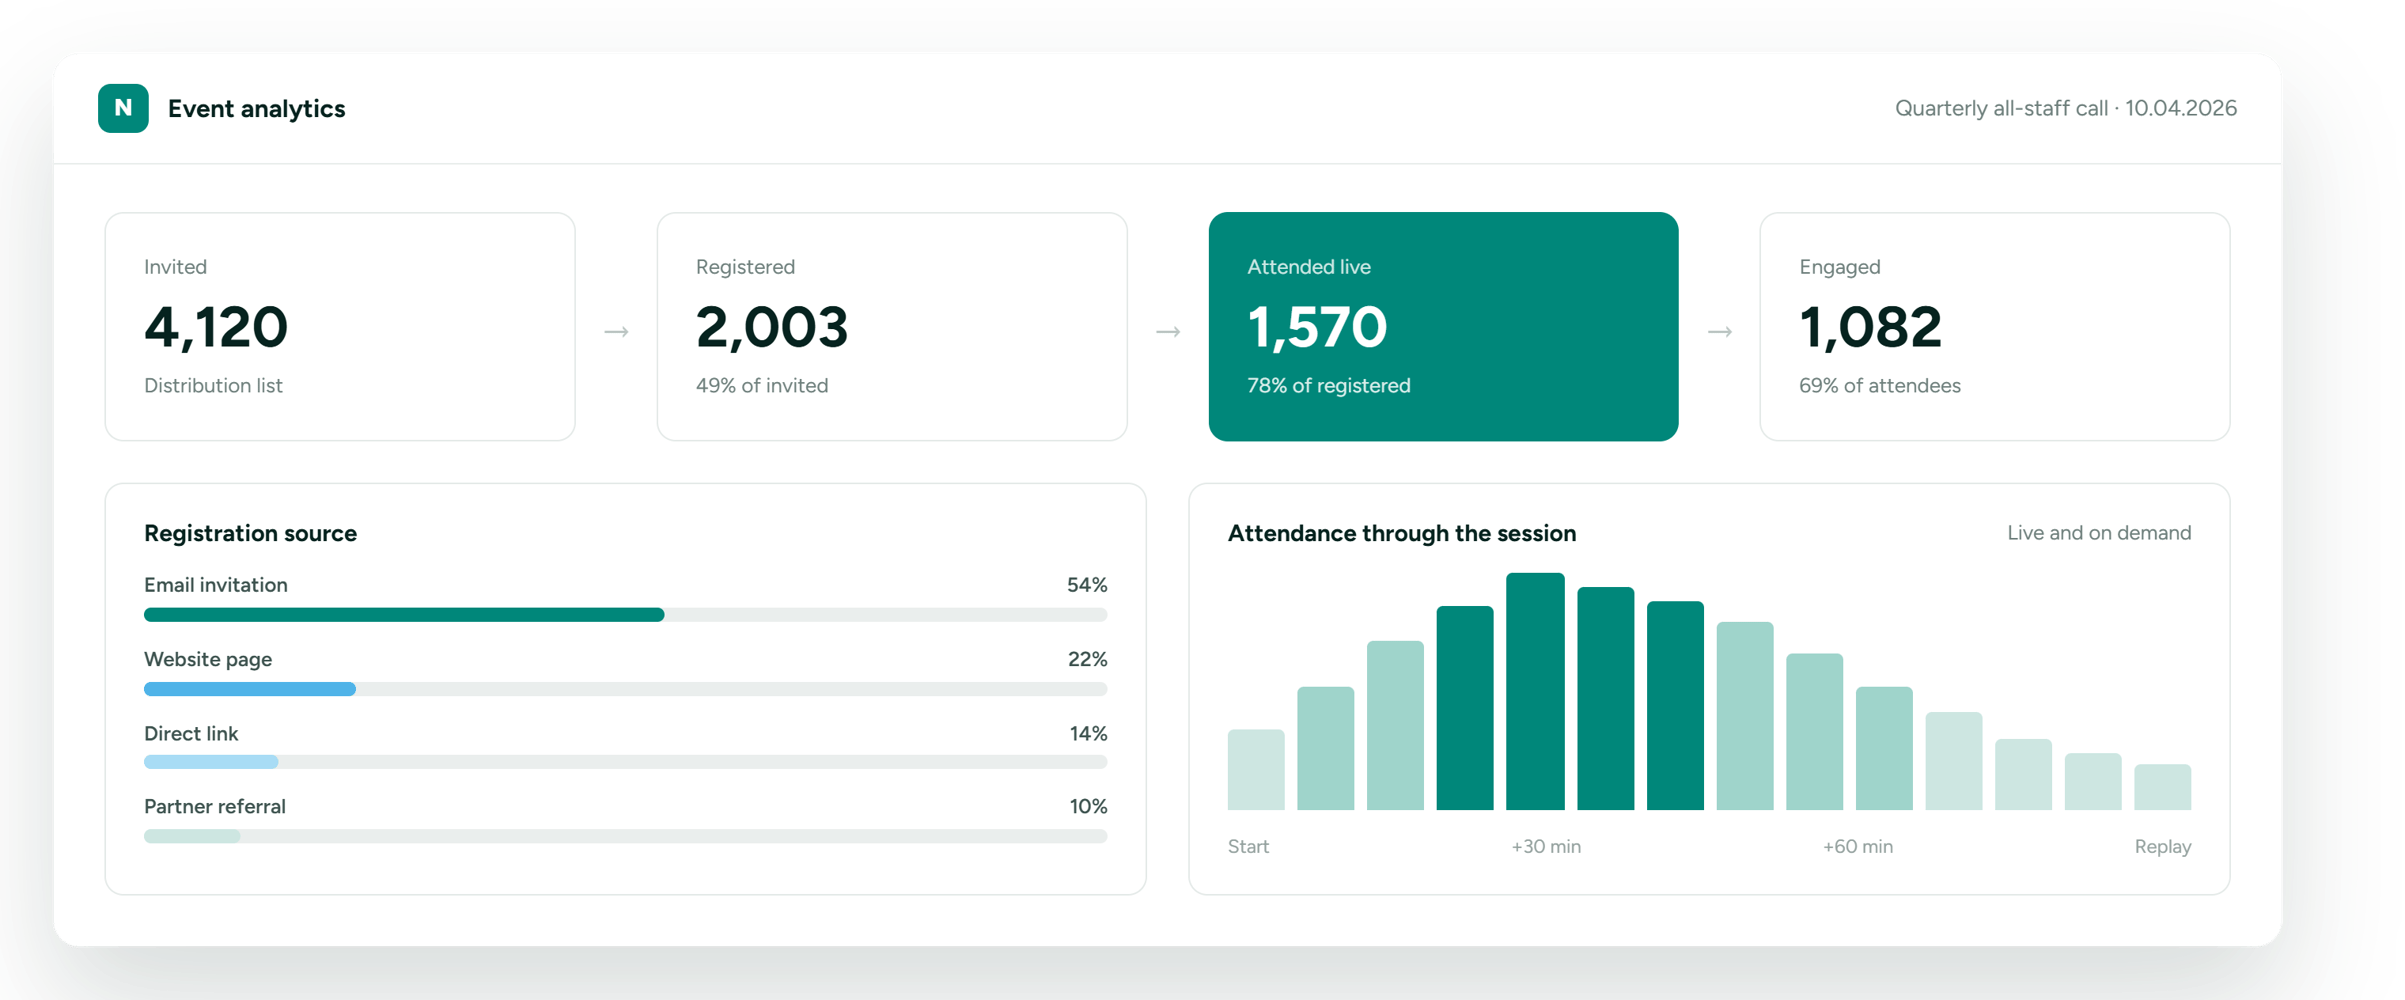
Every webcast generates valuable information about your audience. EngageStream brings together registration data, attendance metrics and engagement activity in a single dashboard, helping teams measure performance and identify opportunities to improve future events.
- Registration data
- Attendance statistics
- Viewing activity
- Poll participation
- Q&A activity
- Geographic insights
- Exportable Excel reports

SELF-SERVICE DASHBOARD
Access your analytics whenever you need them
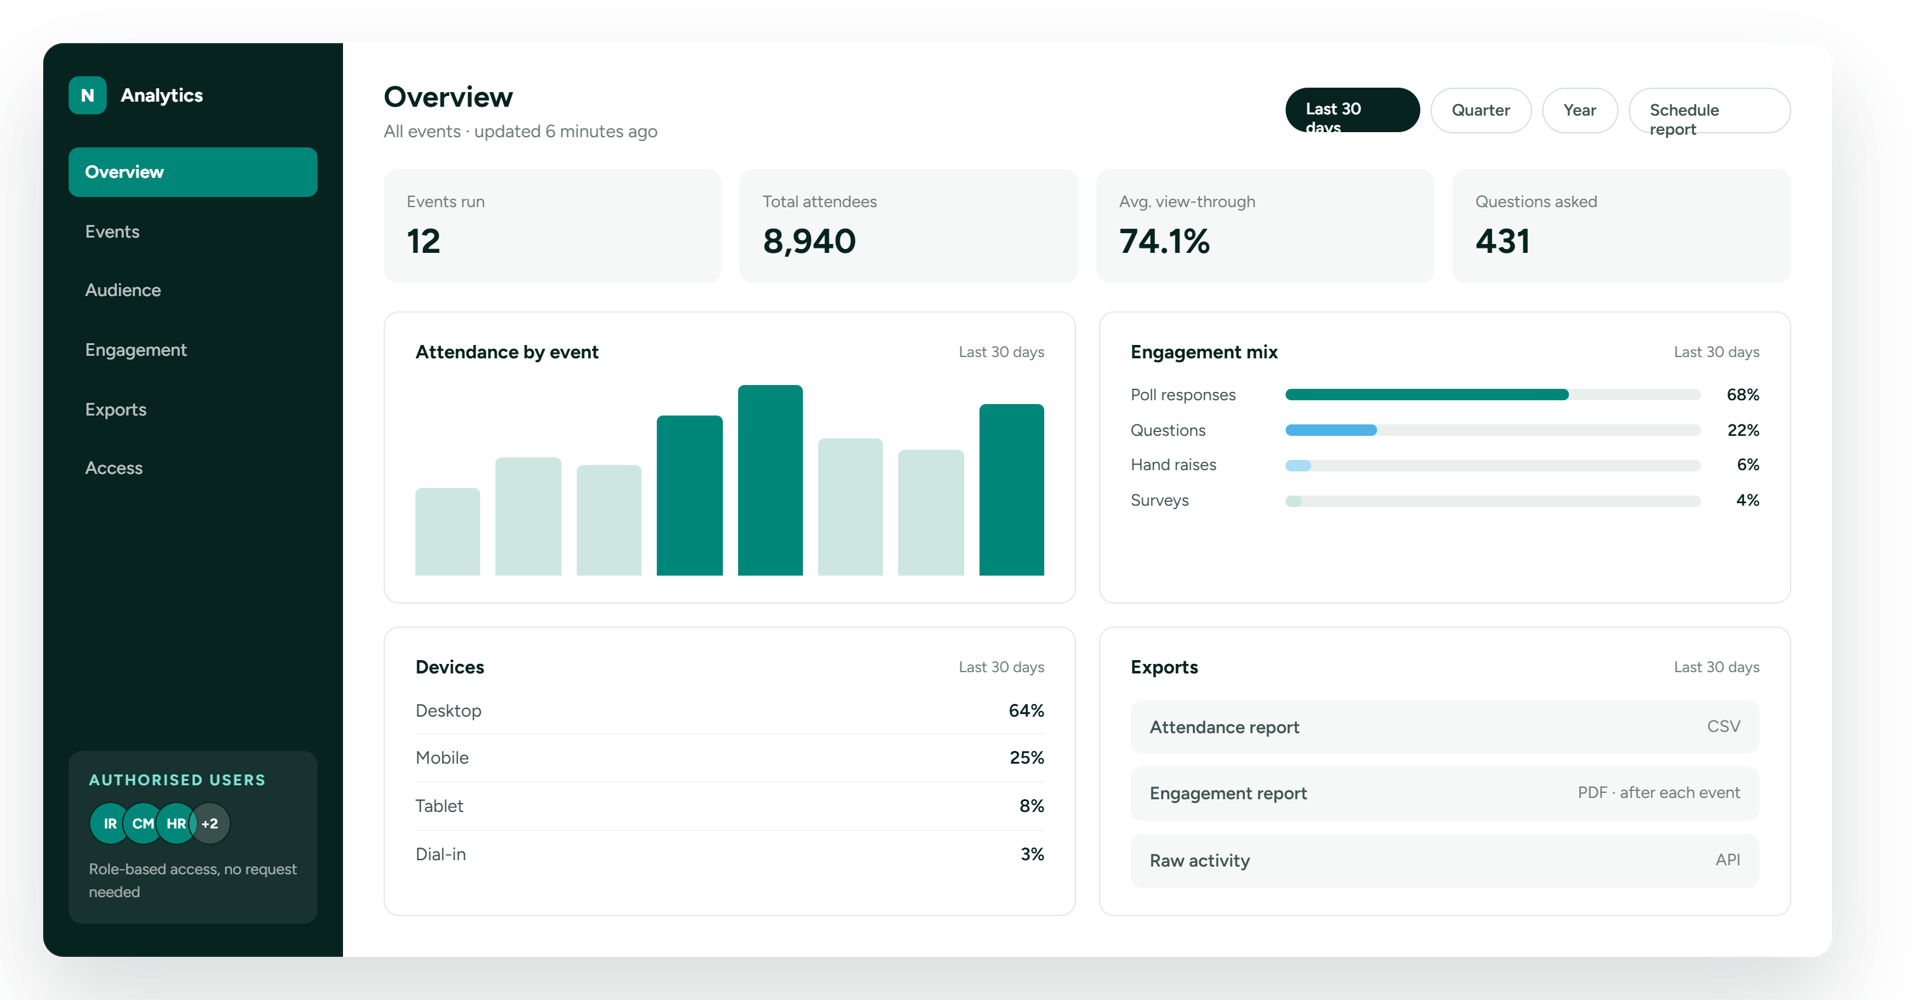
Your event data is available through a dedicated analytics dashboard, allowing authorised users to monitor performance independently.
Instead of requesting reports from your event provider, teams can log in and access event statistics whenever needed throughout the hosting period.
This makes it easier to review results, compare performance and share insights internally.
AUDIENCE INSIGHTS
Understand how your audience participated
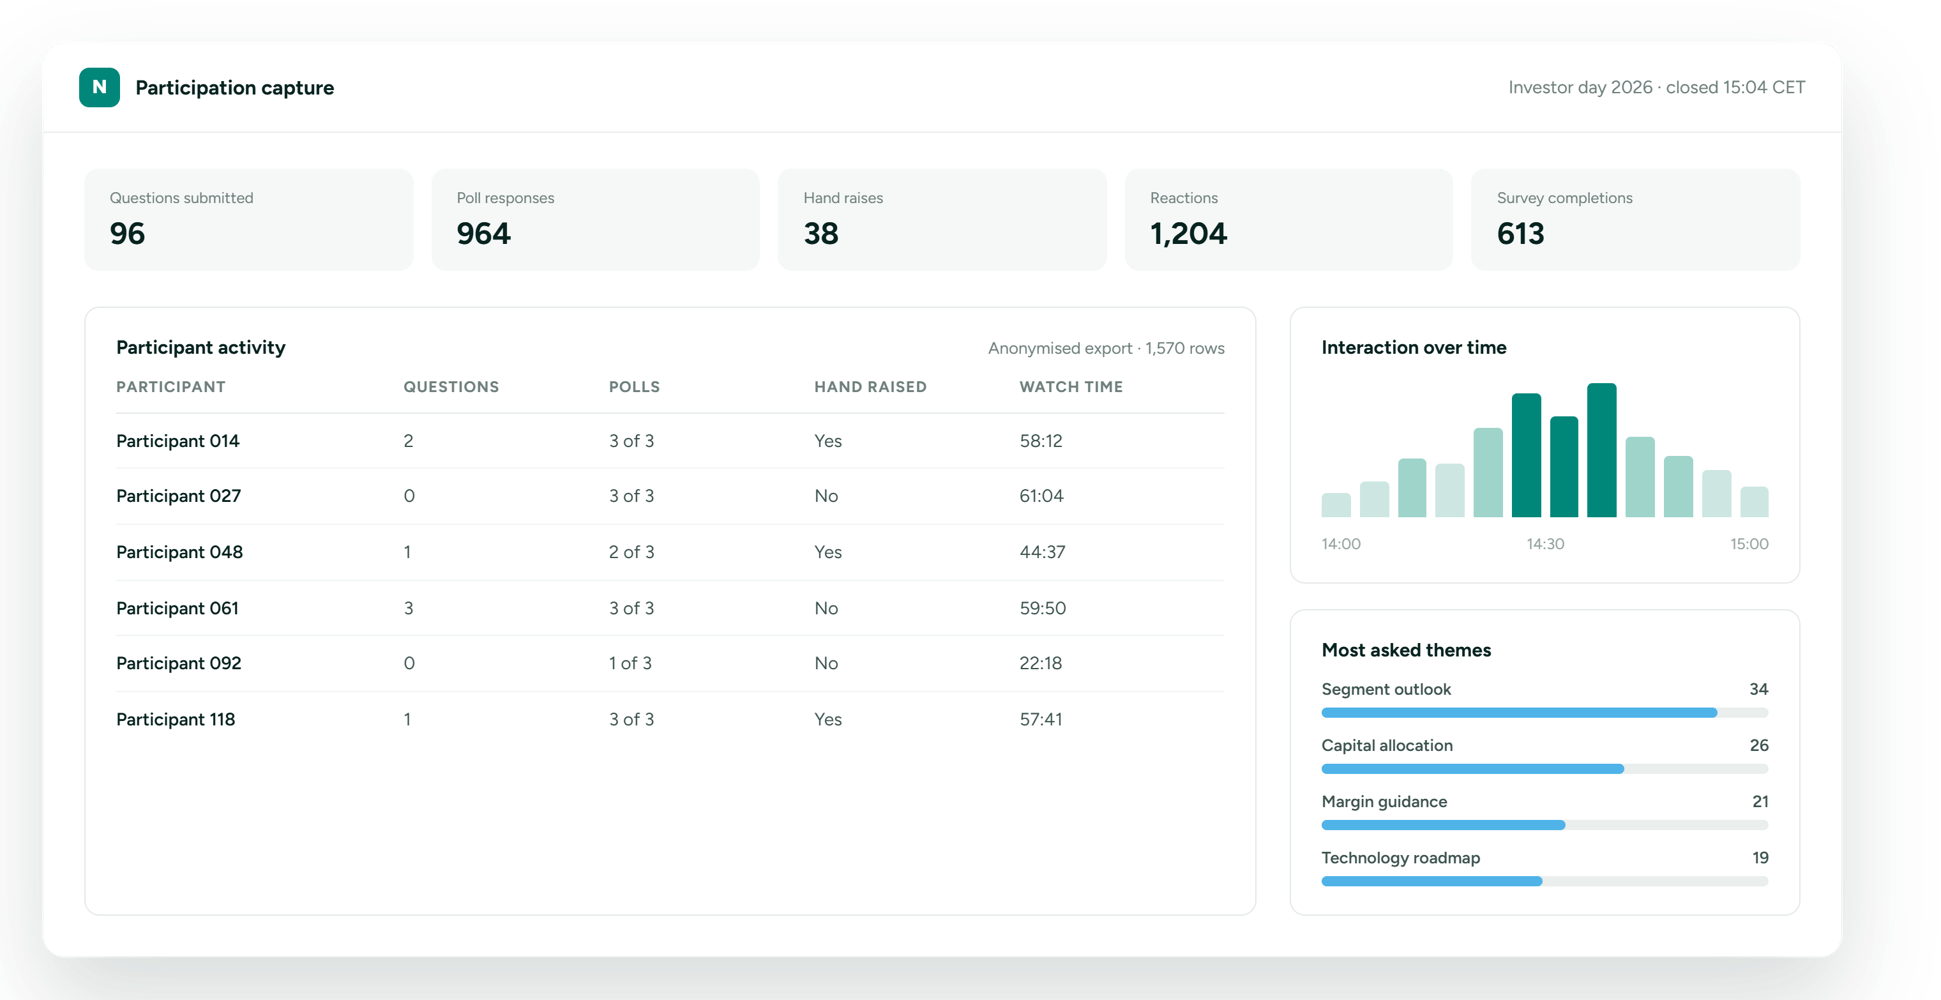
EngageStream helps you understand how attendees interacted throughout your webcast by capturing audience activity such as submitted questions, poll responses and hand raises.
These insights help Investor Relations and Corporate Communications teams evaluate engagement levels and better understand audience interests.

“The platform allows us to go beyond a standard webinar format and adopt a more engaging, "TV-show" style approach, with professional production, branding, and multilingual delivery.”
Emmanuel Andrey
Corporate Communication Chief Officer, Inetum

ISO 27001 Certified
Information security, independently checked

GDPR compliant
Meets EU data-protection standards by design

Secure Streaming
Encrypted communications
Data anonymisation
Configure how long attendee information is retained before it is automatically anonymised